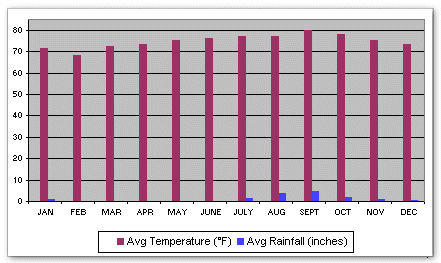
With a all year round location. Perfect tropical dry climate with very little rainfall.
Low humidity & long dry season November – July. They also have No Hurricanes. Average air temp
is between 22-27C and sea temp ranges from 21-26C, 3 degrees warmer than the
Canaries with sunshine levels of 10 to 12 hours per day. Daily highs range from 20°C
(68°F) to around 29°C (84°F) from August to
October, when there can also be rainstorms.
Because it is situated in a zone where the Northeast winds
predominate and increase intensity until the month of July,
Cape Verde has a milder climate than those neighbouring
countries located on the same latitude.
The rainy season is during August, September and October. However, this does not prevent Cape Verde from
enjoying Summer all year round. The East winds blowing from the
African continent is extremely warm and usually arrives during
January and February.
The climate is tropical and dry. There are two seasons, a dry season between November and July
with some
rain between August and October. Daily hours of sunshine vary from around 6-7
between August and October and 10-12 for the rest of the year. The
ocean creates a maritime temperate climate. Total precipitation averages around 260mm (10 inches) per year of which over
90% falls between August and October. Wind speed averages around 13 knots,
dropping to 9 knots in the summer brought in by the north east trade winds.
The wind helps provide a welcome cooling on the coast.

| Month | Average Sunlight (hours) | Temperature | Discomfort from heat and humidity | Relative humidity | Average Precipitation (mm) | Wet Days (+0.25 mm) | ||||
|---|---|---|---|---|---|---|---|---|---|---|
| Average | Record | |||||||||
| Min | Max | Min | Max | am | pm | |||||
| Jan | 7 | 20 | 25 | 17 | 30 | Moderate | 63 | 59 | 3 | 0.9 |
| Feb | 8 | 19 | 25 | 13 | 31 | Moderate | 59 | 57 | 0 | 0.3 |
| March | 9 | 20 | 26 | 17 | 33 | Moderate | 58 | 55 | 0 | 0.1 |
| April | 10 | 21 | 26 | 18 | 34 | Moderate | 58 | 54 | 0 | 0 |
| May | 10 | 21 | 27 | 18 | 33 | Medium | 59 | 55 | 0 | 0 |
| June | 9 | 22 | 28 | 19 | 34 | Medium | 62 | 59 | 0 | 0 |
| July | 7 | 24 | 28 | 19 | 33 | Medium | 68 | 66 | 5 | 0.5 |
| Aug | 6 | 24 | 29 | 22 | 32 | High | 73 | 71 | 97 | 8 |
| Sept | 7 | 25 | 29 | 22 | 34 | High | 74 | 73 | 114 | 7 |
| Oct | 8 | 24 | 29 | 22 | 33 | Medium | 69 | 65 | 31 | 3 |
| Nov | 8 | 23 | 28 | 20 | 32 | Medium | 64 | 63 | 8 | 0.9 |
| Dec | 7 | 22 | 26 | 18 | 31 | Medium | 63 | 62 | 3 | 0.5 |